Grafana and Influx DB Setup for Windows
Grafana Introduction:
- Grafana is open source visualization and analytics software.
- Grafana is used for data monitoring , analysis and data visualization. It allows you to query, visualize, alert on, and explore your metrics.
In this post we will see how to install grafana and Influx DB with telegraf connection for Windows 10
Grafana Installation Setup:
- https://grafana.com/grafana/download?platform=windows
- Above link is navigate to the grafana downloading page

3. Select which version grafana you want. By default, grafana selected latest version.
4.Then, You can download Zip file or Directly download the installer for selected version. You are recommended to directly download the installer.
5. After downloading go to the file path, click to install grafana.

6. To run Grafana, open your browser and go to the Grafana port (http://localhost:3000/ is default)
7. If you are downloaded standalone windows binary, extract this folder to anywhere you want Grafana to run from
8. Start Grafana by executing grafana-server.exe, located in the bin directory. For example,


9. On the login page, enter admin for username and password.
10.Click Log in. If login is successful, then you will see a prompt to change the password.
11. It will navigate to grafana dashboard page.

Influx DB setup
Influx DB is an open-source time series database (TSDB) developed by InfluxData. It is optimized for fast, high-availability storage and retrieval of time series data in fields such as operations monitoring, application metrics, IoT sensor data, and real-time analytics.
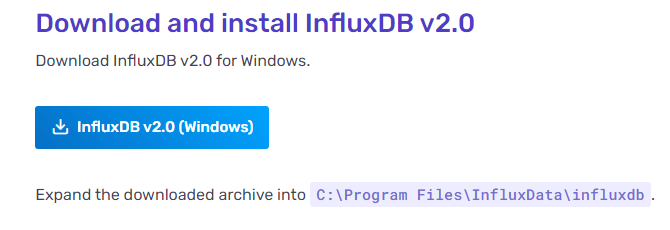
Steps to install Influx DB:
- Download Zip file from below link
- https://docs.influxdata.com/influxdb/v2.0/get-started/?t=Windows
- Extract this folder to anywhere you want Influx DB to run from
4. Run influxDB by using influxd command in command prompt

5. Visit:localhost:8086 and get started
6. Give username , password , organization name and bucket name. Then, it will navigate to below page.

Telegraf setup
- https://dl.influxdata.com/telegraf/releases/telegraf-1.18.3_windows_amd64.zip
- Use above link to download telegraf zip file.
- Extract this telegraf zip file into the influx DB directory
- Create telegraf config file in influx DB and download it.

5. Copy the downloaded configuration file and paste it to extracted telegraf folder
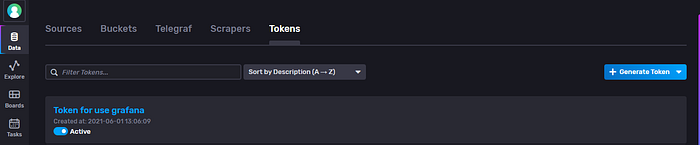
6. Generate one token in Influx DB by click on the generate token and open that token file, copy the token
7. Now, open the telegraf configuration file in any text editor. Paste that copied token in token variable and save the file.
8. Run telegraf by using this command in telegraf directory .\telegraf.exe -config .\<config file name>

9. After using of this command, influx DB and telegraf will be connect.
10. Now, connect influxDB with grafana.
Connect influx DB with Grafana
- Open the grafana dashboard and go to the data source tab by click on the settings icon in side bar.

2. Click on the add data source button and select Influx DB data source.
3. In query language dropdown select flux.
4. Give http port URL http://localhost:8086
5. In influxDB details column give Organization name, token and default bucket name. Those three fields are given from influxDB.